


Summer RV Travel: How Heat Turns
Tire Pressure Into a Moving Target All Day Long
Your 7am pressure check is accurate for the driveway. By 2pm on a desert highway, it tells you nothing about where your tires actually are — and the gap can be 10 PSI or more.
June marks the start of peak RV travel season — and peak RV tire failure season. The two are not unrelated. Summer driving combines three independent heat sources that compound each other across a single day: ambient air temperature that rises from morning cool to afternoon peak, solar radiation absorbed directly by dark tire sidewalls, and friction heat generated internally by the tire carcass rotating under highway load. Each source adds pressure. All three operating simultaneously can push a tire 10 or more PSI above its morning cold reading before the first rest stop. A real-time RV tire pressure monitor tracks where pressure actually is throughout this cycle — not just where it was when you left the campsite at 7am.
The morning cold check is necessary and correct. It establishes the right baseline. What it cannot do is predict where tire pressure will be at mile 150, at 95°F ambient, under full load, on a dark interstate surface absorbing solar heat. That requires continuous monitoring — and summer is the season where the difference between departure pressure and mid-trip pressure is largest, most variable, and most likely to cross into territory that affects tire longevity and safety.
This article maps the pressure changes that happen across a typical summer driving day, identifies the specific scenarios where those changes create the highest risk, and explains what a correctly configured monitoring system should be showing at each stage of the drive.
The Full-Day Pressure Curve
What Actually Happens to Tire Pressure From 7am to 4pm
Most RV owners think of tire pressure as something they set in the morning and check again if something feels wrong. In summer driving, pressure is not a static value — it moves continuously in response to temperature and load, and the total swing from pre-departure cold reading to peak mid-afternoon highway value is significant enough to matter for both performance and safety.
65°F
Highway
80°F
90°F
98°F
Rest Stop
The Four High-Risk Scenarios
When the Summer Pressure Curve Creates Specific Danger Points
Desert Highway Sustained High Speed
I-10, I-40, and I-8 corridors in June through August. Ambient temperatures 100–115°F. Dark asphalt surface adds radiant heat to sidewalls. Sustained 65+ mph adds maximum friction heat. All three heat sources at peak simultaneously — the highest total tire temperature of any common RV driving scenario.
Mountain Descent After Sustained Climb
A long uphill grade at reduced speed generates sustained friction heat without adequate airflow cooling. Braking on the subsequent descent adds brake-generated heat that transfers into the tire and wheel assembly. A tire entering a mountain descent already at peak summer temperature may exceed safe limits before the valley floor.
Post-Rest-Stop Re-Departure
After a 30-minute rest stop, tires have cooled and pressure has dropped. The driver returns to highway speed and friction heat rapidly rebuilds on tires that were at peak temperature before the stop. The combination of a recent cool-down followed by rapid re-heating can create thermal stress in tires already at the edge of their heat tolerance.
Overloaded Departure at High Ambient Temperature
A fully loaded RV departing in mid-morning heat — 80°F at 9am — skips the early-morning cool window. The morning cold check was taken at a temperature significantly above the reference temperature for the inflation specification. By mid-afternoon, the starting point was already elevated, and the full summer heat stack pushes pressure to the maximum faster than a cooler departure would.
The Numbers
How Much Pressure Can Change in a Single Summer Drive
Summer Monitoring Protocol
How to Manage Tire Pressure Correctly Across a Full Summer Drive
Depart Early — Before Ambient Temperature Peaks
A 6–7am departure in summer conditions means tires start their temperature rise from a cool baseline. The total pressure rise over the driving day is lower than a mid-morning departure, giving more margin before reaching the upper threshold. Early departure is the single most effective tire management decision in summer RV driving.
Set Cold Inflation for Loaded Weight — Not the Sticker
The correct cold inflation for a fully loaded Class A motorhome may be 10–15 PSI higher than the sticker recommendation for an empty vehicle. Starting the summer heat rise from a lower-than-required baseline means the tire is underinflated for its load at every point in the day's temperature curve.
Configure Both Low and High Pressure Alarms
Summer monitoring requires a high-pressure alarm threshold as well as a low-pressure threshold. Set the high alarm at 15% above the correct cold inflation — the point where continued driving at that pressure affects tire longevity. On a 100 PSI tire, that's approximately 115 PSI.
Check TPMS at Every Rest Stop
A rest stop pressure reading tells you where the tires are after the driving heat has built fully. If pressures are near or above the high alarm threshold, extend the rest stop until they cool before returning to highway speed. Do not release air from hot tires — the pressure will drop when they cool and you'll be underinflated on re-departure.
Plan Mountain Descents With Current Readings
Before a significant mountain descent, check TPMS readings. A tire already at 108 PSI after a sustained climb will add brake heat on the descent. If pressure is already near the high threshold, stop at the descent head and allow tires to cool before proceeding.
For Class A diesel pushers and heavy commercial chassis RVs where axle pressures run 100–120 PSI and the summer heat stack can push operating pressure toward 130 PSI, the Grundig S08 heavy-duty system provides 218 PSI ceiling coverage across 8 and 12-wheel configurations. Browse the full Grundig TPMS lineup to find the right match for your specific vehicle and axle configuration.
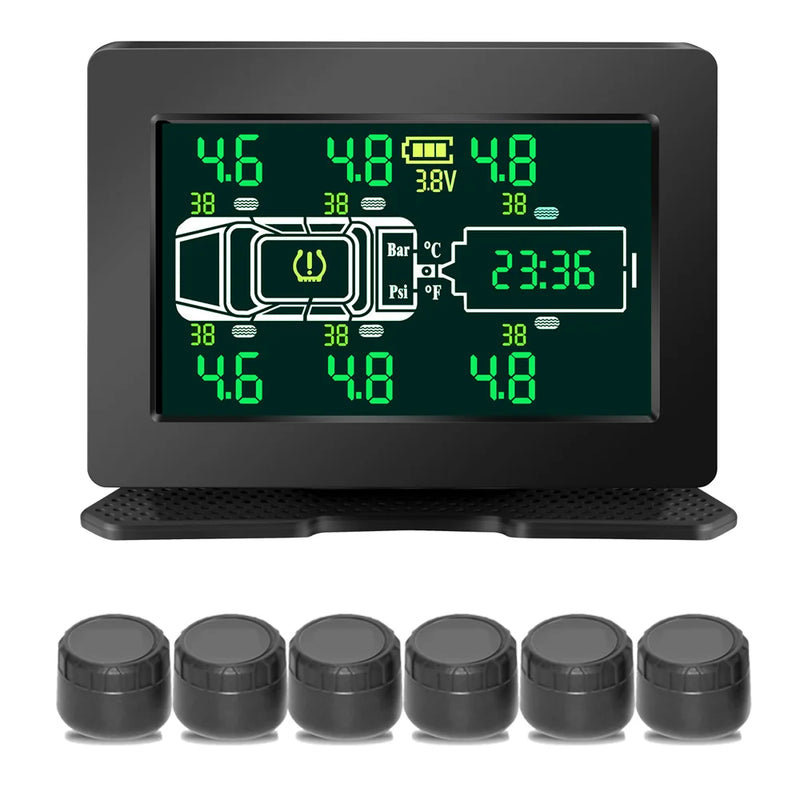
Grundig RV TPMS
4/6/8-Wheel Switchable
116 PSI range, ±1.5 PSI precision. Real-time pressure AND temperature across all positions. Catches both low and high pressure events — critical in summer when both underinflation and overinflation are real risks. 5.0" display. $119. Free shipping.
$119
Shop Now →Track the full summer pressure curve — not just the morning baseline. Free shipping · 116 PSI range · Real-time pressure & temperature
Shop RV TPMS →